Understanding the conduction system | Using light switches as analogy!
Components of the conduction system
The components that makes up the conduction system includes the pacemaker of the heart, also known as the sino-atrial node (SAN). The atrioventricular node (AVN) which sits between the top and bottom half of the heart and the subsequent fibers (Bundle of His, left and right bundles and Purkinje fibres) to relay the electrical signal to the bottom part of the heart.
An analogy that I normally like to use is that the conduction system of the heart is like the light switches and lights we have in our homes.
House analogy – Setting the scene
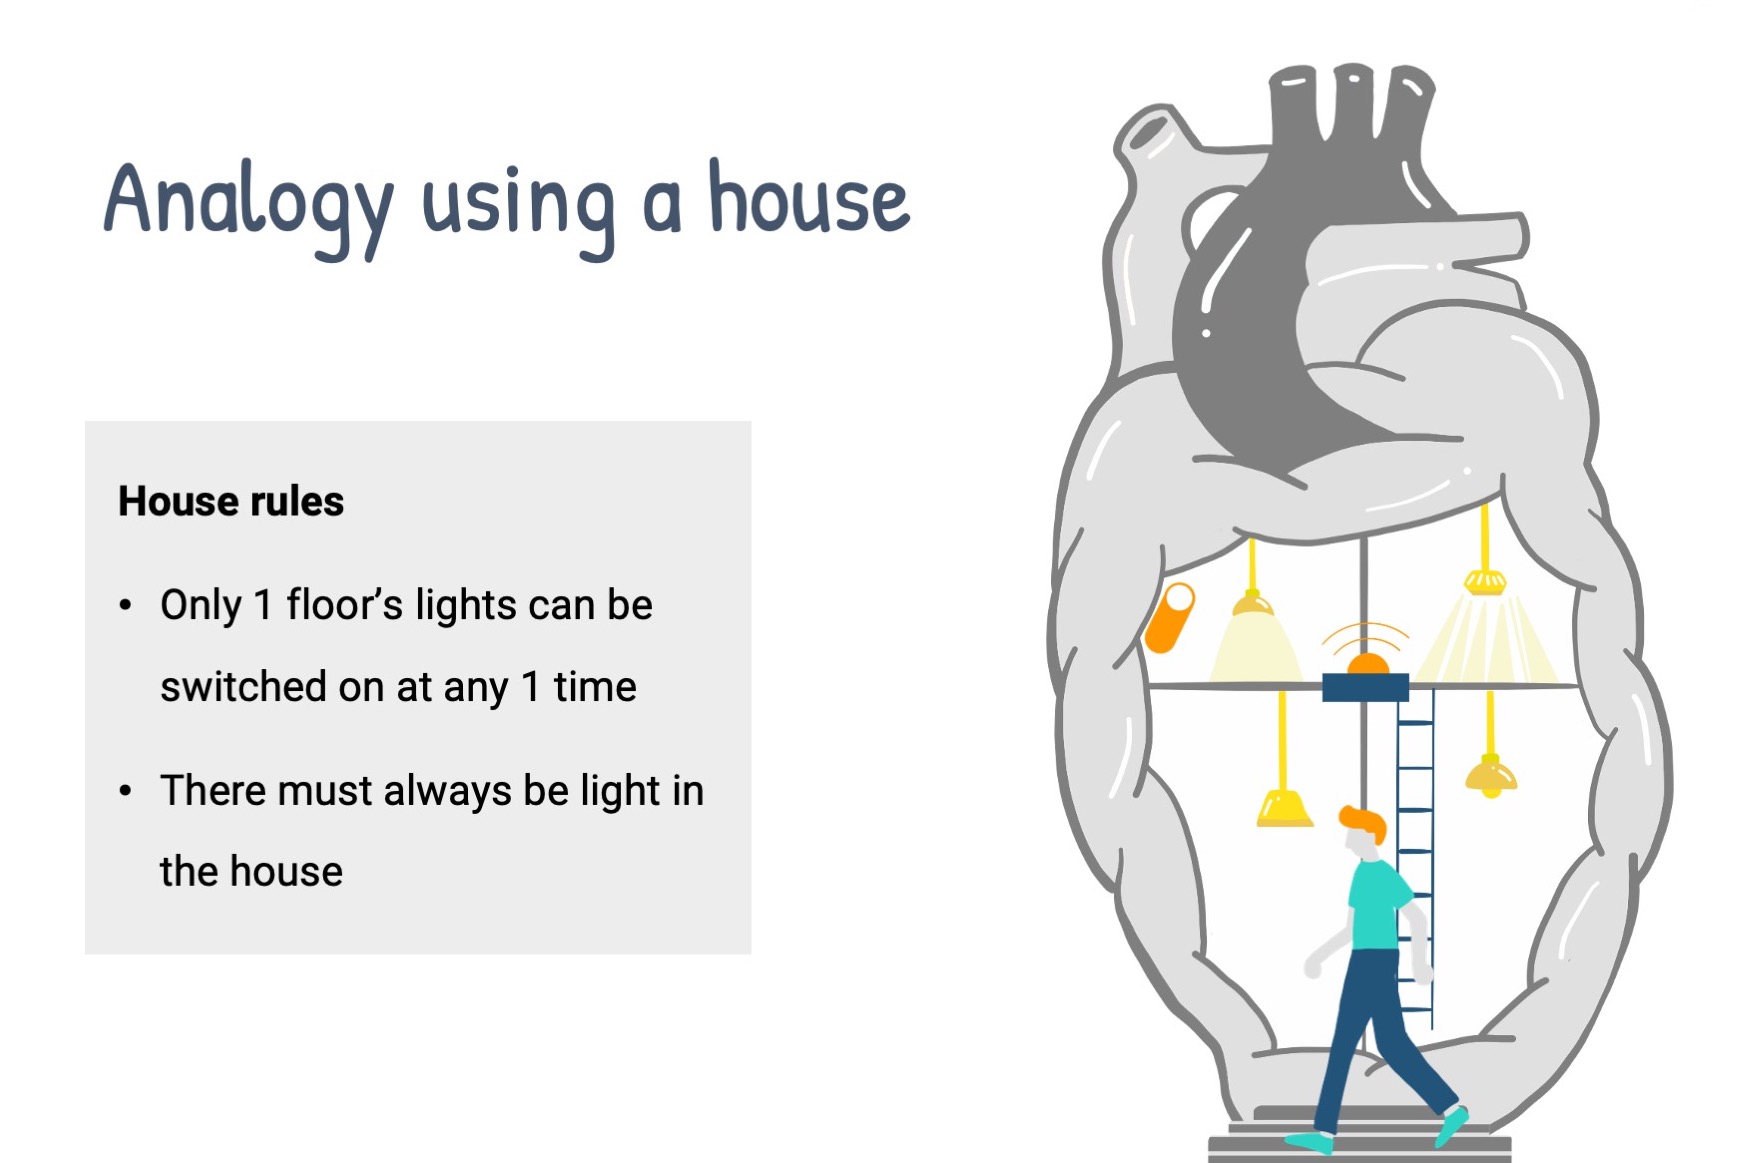
Imagine the heart as a house and the conduction system is the complex wiring that controls the heart. There are some house rules: 1. Only 1 floor’s lights can be switched on at any 1 time and 2. There must always be light in the house.
The switch (sino-atrial node) controlling the top floor (atria in this analogy) is manually operated by Alfred (our fictional owner of the house). The lights on the ground floor is controlled by a switch that has a light sensor attached – it will switch on when it senses light coming from the top floor. The switching on and off of the lights represent contraction or the squeezing action of the heart muscles.
A normal heart beat
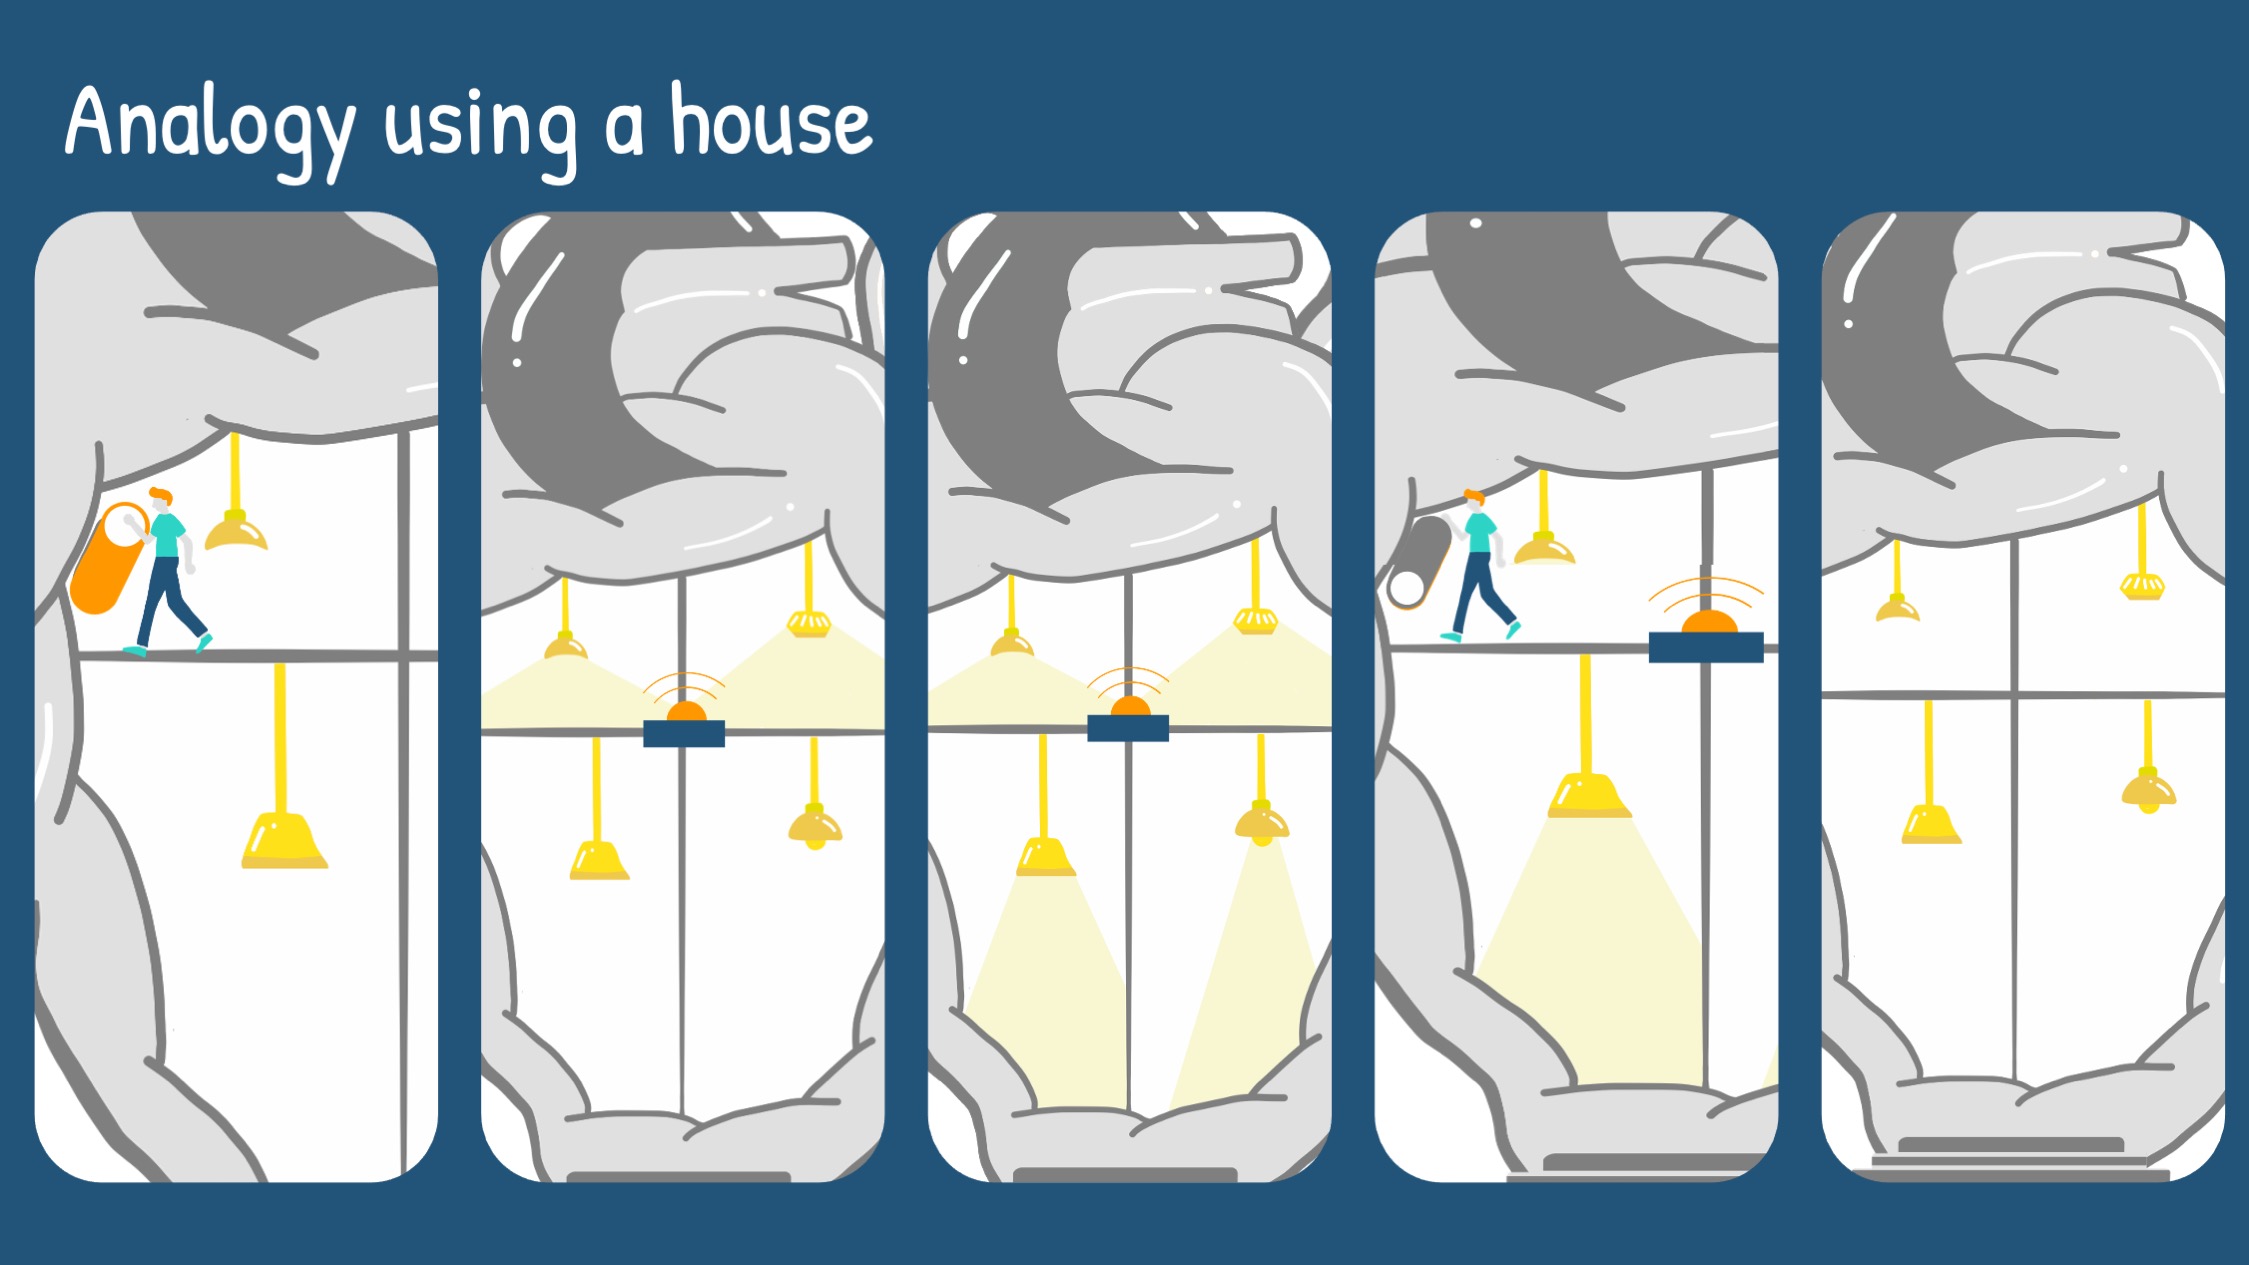
In normal circumstances, Alfred controls the top floor switch, turning it on which brings on the lights on the top floor. The light shines across the room and is detected by the sensors of the ground floor switch. This in turn triggers the lights to come on the ground floor. When Alfred sees light from the ground floor (remembering the house rules that there can only be one floor that has light), he switches off the lights on the top floor. This then leads to the loss of light stimulating the light sensor switch and the subsequent switching off of the ground floor lights. Again, Alfred sees that the house is now in total darkness and remembering the second house rule, he turns on the lights on the top floor. The cycle repeats and this represents a normal heartbeat.
Relating to ECG
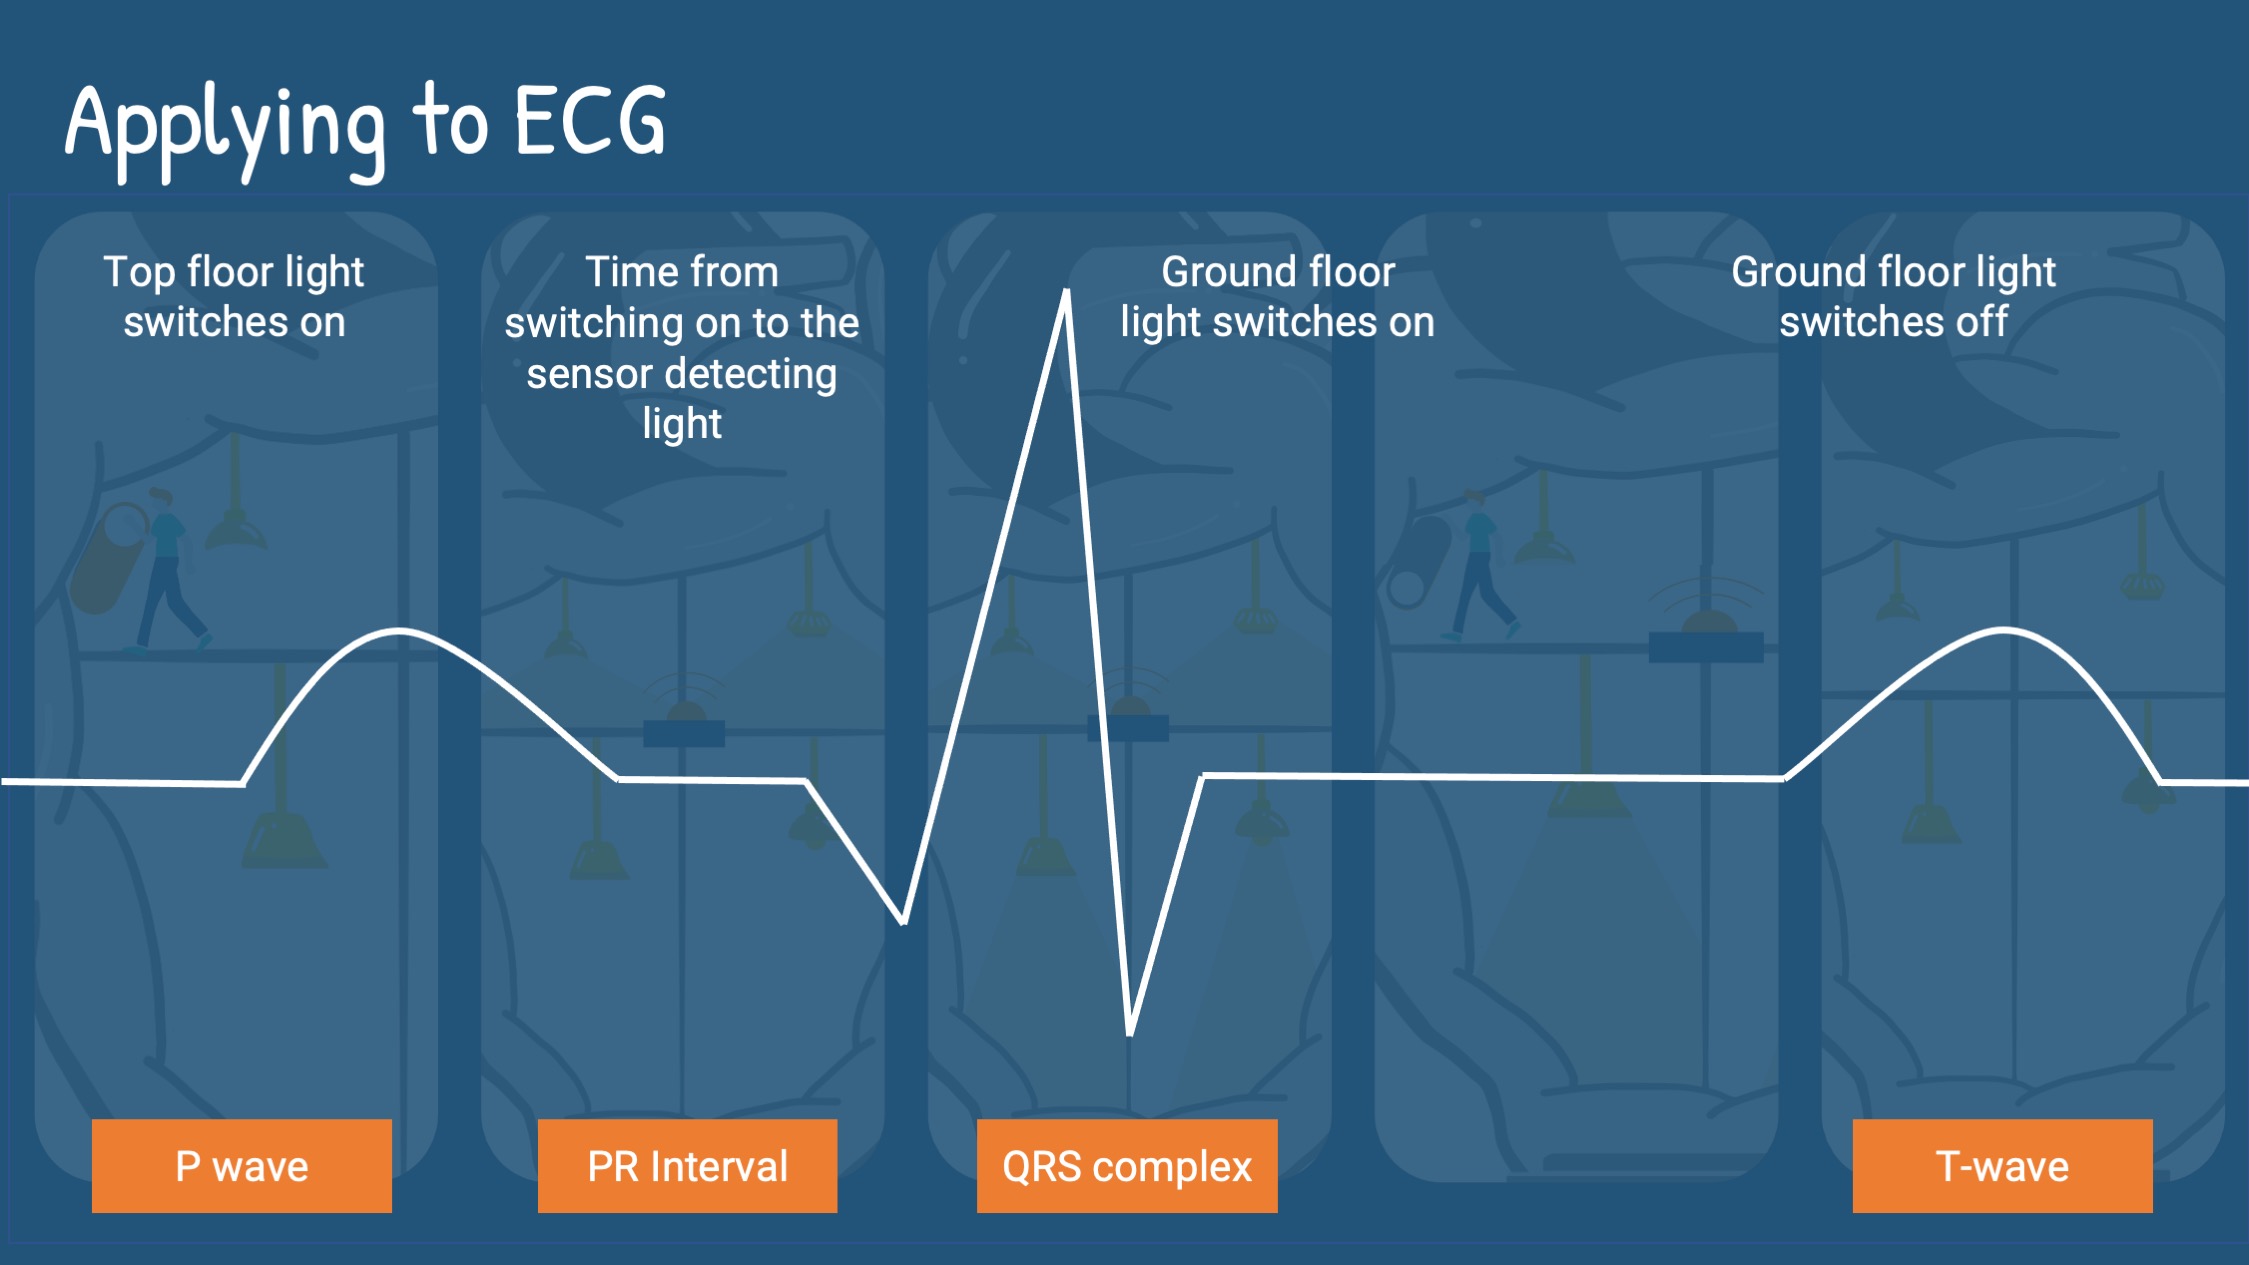
The different waves on the ECG can also be explained using this analogy.
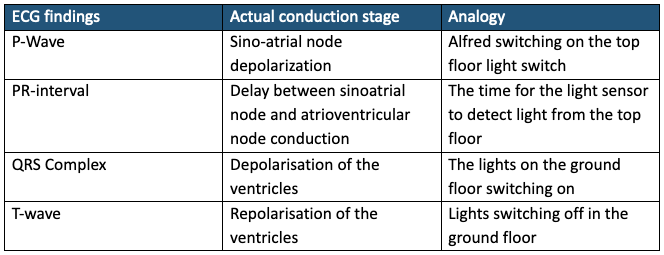
The p-wave signifies Alfred switching on the lights on the top floor (and also the contraction of the atria). As it takes time for the light sensor to detect the light, this is represented by the PR interval. The light sensor switch activates the lights on the ground floor, and the ventricles contract which is represented by the QRS complex. As the repolarization of the ventricles occur during the T-wave, the lights of the ground floor are switched off due to loss of stimulation of the light sensor switch.
